Aquatic Animal Health Code
|
Aquatic Animal Health Code |

Aquatic animal health surveillance
Introduction and objectives
Surveillance activities may be performed to achieve any of the following objectives:
demonstrating the absence of disease;
identifying events requiring notification as listed in Article 1.1.3.;
determining the occurrence or distribution of endemic disease, including changes to their incidence or prevalence (or its contributing factors), in order to:
provide information for domestic disease control programmes,
provide relevant disease occurrence information to be used by trading partners for qualitative and quantitative risk assessment.
The type of surveillance applied depends on the desired outputs needed to support decision-making. Surveillance data determine the quality of disease status reports and should satisfy information requirements for accurate risk analysis both for international trade as well as for national decision-making. Surveillance of endemic diseases provides valuable information for day-to-day health management and can act as the foundation for detecting outbreaks of exotic disease and demonstrating specific disease freedom.
Surveillance systems described in this chapter should also be used to generate information for decisions on prescribed disease prevention and control programmes. However, the actual strategies for prevention and control are beyond the scope of this chapter on surveillance recommendations.
Having a suitable management strategy to respond to surveillance data is of utmost importance for the successful implementation of surveillance systems.
Essential prerequisites to enable a Member Country to provide information for the evaluation of its animal health status are:
that the particular Member Country complies with the provisions of Chapter 3.1. on the quality of the Aquatic Animal Health Services;
that, where possible, surveillance data be complemented by other sources of information (e.g. scientific publications, research data, documented field observations and other non-survey data);
that transparency in the planning and execution of surveillance activities and the analysis and availability of data and information, be maintained at all times, in accordance with Chapter 1.1.
The following recommendations may be applied to all diseases, their agents, and susceptible species as listed in the Aquatic Manual, and are designed to assist with the development of surveillance methodologies. Where possible, the development of surveillance systems using these recommendations should be based on the relevant information in the individual disease chapters in the Aquatic Manual. These recommendations are also applicable to non-listed diseases that may be of importance to a country or region, such as new or emerging diseases. There is sometimes a perception that surveillance can only be conducted using sophisticated methodologies. However, an effective surveillance system can also be developed by making use of gross observations and already available resources.
It would be impractical to try to develop a surveillance system for all the known aquatic animal diseases for which a country has susceptible species. Therefore prioritising the diseases to be included in a surveillance system should be conducted considering:
More detailed information in each disease chapter (where it exists) of the Aquatic Manual may be used to further refine the general approaches described in this chapter. Where detailed disease-specific information is not available, surveillance can also be conducted following the recommendations in this chapter. Access to epidemiological expertise would be invaluable for the design, implementation of the system and interpretation of results derived from a surveillance system.
Principles of surveillance
Surveillance may be based on many different data sources and can be classified in a number of ways, including:
the means by which data are collected (targeted versus non-targeted);
the disease focus (pathogen-specific versus general surveillance); and
the way in which units for observation are selected (surveys versus non-random data sources).
Surveillance activities include:
population-based surveys, such as:
systematic sampling at slaughter;
random surveys;
non-random surveillance activities, such as:
disease reporting or notifications;
control programmes/health schemes;
targeted testing/screening;
post-mortem inspections;
laboratory investigation records;
biological specimen banks;
sentinel units;
field observations;
farm production records.
In addition, surveillance data should be supported by related information, such as:
data on the epidemiology of the disease, including environmental, and host and wild reservoir population distributions;
data on farmed and wild animal movements and trading patterns for aquatic animals and aquatic animal products, including potential for exposure to populations of wild aquatic animals, water sources or other contacts;
national animal health regulations, including information on compliance with them and their effectiveness;
history of imports of potentially infected material; and
biosecurity measures in place.
The sources of evidence should be fully described. A survey should include a description of the sampling strategy used for the selection of units for testing. For non-random data sources, a full description of the system is required including the source(s) of the data, when the data were collected, and a consideration of any biases that may be inherent in the system.
Critical elements of surveillance
In assessing the quality of a surveillance system, the following critical elements need to be addressed.
Populations
Ideally, surveillance should be carried out in such a way as to take into account all animal species susceptible to the disease in a country, zone or compartment. The surveillance activity may cover all individuals in the population or part of them. Estimates of total population at risk for each species are required. When surveillance is conducted only on a subpopulation, care should be taken regarding the inferences made from the results.
For listed diseases, definitions of appropriate populations should be based on the specific recommendations of the disease chapters of the Aquatic Manual.
Epidemiological unit
The relevant epidemiological unit for the surveillance system should be defined and documented to ensure that it is representative of the population or targeted subpopulations that would generate the most useful inferences about disease patterns. Therefore, it should be chosen taking into account factors such as carriers, reservoirs, vectors, immune status, genetic resistance and age, sex, and other host criteria.
Clustering
Disease in a country, zone or compartment usually clusters rather than being uniformly or randomly distributed through a population. Clustering of disease may occur in space (e.g. tank, pond, farm, or compartment), time (e.g. season), or animal subgroups (e.g. age, physiological condition). Clustering should be taken into account in the design of surveillance activities and interpretation of surveillance data.
Case and outbreak definitions
Clear and unambiguous case definitions and outbreak definitions should be developed and documented for each disease under surveillance, using, where they exist, the standards in this chapter and the Aquatic Manual.
Analytical methodologies
Surveillance data should be analysed using appropriate methodologies, and at the appropriate organisational levels to facilitate effective decision-making, whether it be planning interventions or demonstrating status.
Methodologies for the analysis of surveillance data should be flexible to deal with the complexity of real life situations. No single method is applicable in all cases. Different methodologies may be needed to accommodate the relevant pathogens, varying production and surveillance systems, and types, quality, and amounts of data/information available.
The methodology used should be based on the best available information that is in accord with current scientific thinking. The methodology should be in accordance with this chapter and fully documented, and supported by reference to the scientific literature and other sources, including expert opinion. Sophisticated mathematical or statistical analyses should only be carried out when justified by the proper amount and quality of field data.
Consistency in the application of different methodologies should be encouraged and transparency is essential in order to ensure fairness and rationality, consistency in decision-making and ease of understanding. The uncertainties, assumptions made, and the effect of these on the final conclusions should be documented.
Testing
Surveillance involves the detection of disease by the use of appropriate case definitions based on the results of one or more tests for evidence of disease status. In this context, a test may range from detailed laboratory examinations to field observations and the analysis of production records. The performance of a test at the population level (including field observations) may be described in terms of its sensitivity and specificity and predictive values. Imperfect sensitivity and/or specificity will have an impact on the conclusions from surveillance. Therefore, these parameters should be taken into account in the design of surveillance systems and analysis of surveillance data as described in this chapter.
Although not determined for many aquatic animal diseases, sensitivity and specificity should be estimated as best as possible for a specific testing situation. Alternatively, where values for sensitivity and/or specificity for a particular test and testing situation are estimated in the disease chapter in the Aquatic Manual, these values may be used as a guide.
Samples from a number of aquatic animals or units may be pooled and subjected to a testing protocol. The results should be interpreted using sensitivity and specificity values that have been determined or estimated for that particular pool size and testing procedure.
Quality assurance
Surveillance systems should incorporate the principles of quality assurance and be subjected to periodic auditing to ensure that all components of the system function and provide verifiable documentation of procedures and basic checks to detect significant deviations of procedures from those documented in the design.
Validation
Results from animal health surveillance systems are subject to one or more potential biases. When assessing the results, care should be taken to identify potential biases that can inadvertently lead to an over-estimate or an under-estimate of the parameters of interest.
Data collection and management
The success of a surveillance system is dependent on a reliable process for data collection and management. The process may be based on paper records or computerised. Even where data are collected for non-survey purposes (e.g. during disease control interventions, inspections for movement control or during disease eradication schemes), the consistency and quality of data collection and event reporting in a format that facilitates analysis, is critical. Factors influencing the quality of collected data include:
the distribution of, and communication between, those involved in generating and transferring data from the field to a centralised location;
motivation of the people involved in the surveillance system;
the ability of the data processing system to detect missing, inconsistent or inaccurate data, and to address these problems;
maintenance of disaggregated data rather than the compilation of summary data;
minimisation of transcription errors during data processing and communication.
Population-based surveys
In addition to the principles for surveillance discussed in Article 1.4.6., the following recommendations should be used when planning, implementing and analysing surveys.
Types of surveys
Surveys may be conducted on the entire target population (i.e. a census) or on a sample. Periodic or repeated surveys conducted in order to document disease freedom should be done using probability based sampling methods (simple random selection, cluster sampling, stratified sampling, systematic sampling) so that data from the study population can be extrapolated to the target population in a statistically valid manner. Non-probability based sampling methods (convenience, expert choice, quota) can also be used. Recognising the inherent impracticalities in sampling from some aquatic animal populations, non-probability based sampling could be used when biases are recognised and used to optimise detection.
The sources of information should be fully described and should include a detailed description of the sampling strategy used for the selection of units for testing. Also, consideration should be made of any biases that may be inherent in the survey design.
Survey design
The population of epidemiological units should first be clearly defined; hereafter sampling units appropriate for each stage, depending on the design of the survey, should be defined.
The design of the survey will depend on the size and structure of the population being studied, the epidemiology of the disease and the resources available.
Sampling
The objective of sampling from a population is to select a subset of units from the population that is representative of the population with respect to the object of the study such as the presence or absence of disease. Sampling should be carried out in such a way as to provide the best likelihood that the sample will be representative of the population, within the practical constraints imposed by different environments and production systems. In order to detect the presence of a disease in a population of unknown disease status, sampling methods that optimise the detection of disease can be used. In such cases, care should be taken regarding the inferences made from the results.
Sampling methods
When selecting epidemiological units from within a population the objectives of the surveillance system should be considered. In general, probability sampling (e.g. simple random selection) is preferable. When this is not possible, sampling should provide the best practical chance of generating optimal inferences about disease patterns in the target population.
In any case, the sampling method used at all stages should be fully documented and justified.
Sample size
In general, surveys are conducted either to demonstrate the presence or absence of a factor (e.g. disease) or to estimate a parameter (e.g. the prevalence of disease). The method used to calculate sample size for surveys depends on the purpose of the survey, the expected prevalence (also referred to as the threshold prevalence), the level of confidence desired of the survey results and the performance (e.g. sensitivity and specificity estimates) of the tests used.
Non-random data sources used in surveillance
Surveillance systems routinely use non-random data, either alone or in combination with surveys.
Common non-random surveillance data sources
A wide variety of non-random surveillance data sources may be available. These vary in their primary purpose and the type of surveillance information they are able to provide. Some surveillance systems are primarily established as early detection systems, but may also provide valuable information to demonstrate freedom from disease. Other systems provide cross-sectional information suitable for prevalence estimation, either once or repeatedly, while yet others provide continuous information, suitable for the estimate of incidence data (e.g. disease reporting systems, sentinel sites, testing schemes).
Disease reporting or notification system
Data derived from disease reporting systems can be used in combination with other data sources to substantiate claims of animal health status, to generate data for risk analysis, or for early detection. The first step of a disease reporting or notification system is often based on the observation of abnormalities (e.g. clinical signs, reduced growth, elevated mortality rates, behavioural changes, etc.), which can provide important information about the occurrence of endemic, exotic or new diseases. Effective laboratory support is, however, an important component of most reporting systems. Reporting systems relying on laboratory confirmation of suspect clinical cases should use tests that have a high specificity. Reports should be released by the laboratory in a timely manner, with the amount of time from disease detection to report generation minimised.
Control programmes/health schemes
Animal disease control programmes or health schemes, while focusing on the control or eradication of specific diseases, should be planned and structured in such a manner as to generate data that are scientifically verifiable and contribute to surveillance.
Targeted sampling
This may involve sampling targeted to selected sections of the population (subpopulations), in which disease is more likely to be introduced or found. Examples include selecting culled and dead animals for testing, animals exhibiting clinical signs, animals located in a defined geographical area and specific age or commodity group.
Post-harvest inspections
Inspections of aquatic animal slaughter premises or processing plants may provide valuable surveillance data provided diseased aquatic animals survive to slaughter. Post-harvest inspections are likely to provide good coverage only for particular age groups and geographical areas. Post-harvest surveillance data are subject to obvious biases in relation to target population and study population (e.g. only animals of a particular class and age may be slaughtered for human consumption in significant numbers). Such biases need to be recognised when analysing surveillance data.
Both for traceback in the event of detection of disease and for analysis of spatial and population-level coverage, there should be, if possible, an effective identification system that relates each animal in the slaughter premises/processing plant to its locality of origin.
Laboratory investigation records
Analysis of laboratory investigation records may provide useful surveillance information. The coverage of the system will be increased if analysis is able to incorporate records from national, accredited, university and private sector laboratories. Valid analysis of data from different laboratories depends on the existence of standardised diagnostic procedures and standardised methods for interpretation and data recording. If available, the method listed in the Aquatic Manual in relation to the purpose of testing should be used. As with post-harvest inspections, there needs to be a mechanism to relate specimens to the farm of origin. It should be recognised that laboratory submissions may not accurately reflect the disease situation on the farm.
Biological specimen banks
Specimen banks consist of stored specimens, gathered either through representative sampling or opportunistic collection or both. Specimen banks may contribute to retrospective studies, including providing support for claims of historical freedom from disease, and may allow certain studies to be conducted more quickly and at lower cost than alternative approaches.
Sentinel units
Sentinel units/sites involve the identification and regular testing of one or more of animals of known health/exposure status in a specified geographical location to detect the occurrence of disease. They are particularly useful for surveillance of diseases with a strong spatial component, such as vector-borne diseases. Sentinel units provide the opportunity to target surveillance depending on the likelihood of disease (related to vector habitats and host population distribution), cost and other practical constraints. Sentinel units may provide evidence of freedom from disease, or provide data on prevalence and incidence as well as the distribution of disease. Cohabitation of sentinel units (preferably of the most susceptible species and life stage) with a susceptible population should be considered for testing disease in populations of valuable animals, the lethal sampling of which may be unacceptable (e.g. ornamental fish) or in animal subpopulations where sampling techniques are incapable of detecting the presence of disease or infection (e.g. where vaccination means that serological tests are inapplicable).
Field observations
Clinical observations of epidemiological units in the field are an important source of surveillance data. The sensitivity and/or specificity of field observations may be relatively low, but these can be more easily determined and controlled if a clear, unambiguous and easy to apply standardised case definition is applied. Education of potential field observers in application of the case definition and reporting is an important component. Ideally, both the number of positive observations and the total number of observations should be recorded.
Farm production records
Systematic analysis of farm production records may be used as an indicator of the presence or absence of disease at the population level. If production records are accurate and consistently maintained, the sensitivity of this approach may be quite high (depending on the disease), but the specificity is often quite low.
Critical elements for non-random data used in surveillance
There are a number of critical factors that should be taken into account when using non-random surveillance data such as coverage of the population, duplication of data, and sensitivity and specificity of tests that may give rise to difficulties in the interpretation of data. Surveillance data from non-random data sources may increase the level of confidence or be able to detect a lower level of prevalence with the same level of confidence compared to surveys.
Analytical methodologies
Different scientifically valid methodologies may be used for the analysis of non-random surveillance data. This most often requires information on parameters of importance to the surveillance system, such as sensitivity and specificity and prior probabilities of infection, i.e. apparent prevalences (e.g. for predictive value calculations). Where no such data are available, estimates based on expert opinions, gathered and combined using a formal, documented and scientifically valid methodology may be used.
Combination of multiple sources of data
The methodology used to combine the evidence from multiple or recurrent (e.g. time series) data sources should be scientifically valid, and fully documented including references to published material.
Surveillance information gathered from the same country, zone or compartment at different times (e.g. repeated annual surveys) may provide cumulative evidence of animal health status. Such evidence gathered over time may be combined to provide an overall level of confidence. However, a single larger survey, or the combination of data collected during the same time period from multiple random or non-random sources, may be able to achieve the same level of confidence in a shorter period of time.
Analysis of surveillance information gathered intermittently or continuously over time should, where possible, incorporate the time of collection of the information to take into account the decreased value of older information. The sensitivity, specificity and completeness of data from each source should also be taken into account for the final overall confidence level estimation.
Pathways to demonstrate freedom from disease
The different paths to declaration of freedom from disease are summarised in the diagram below.
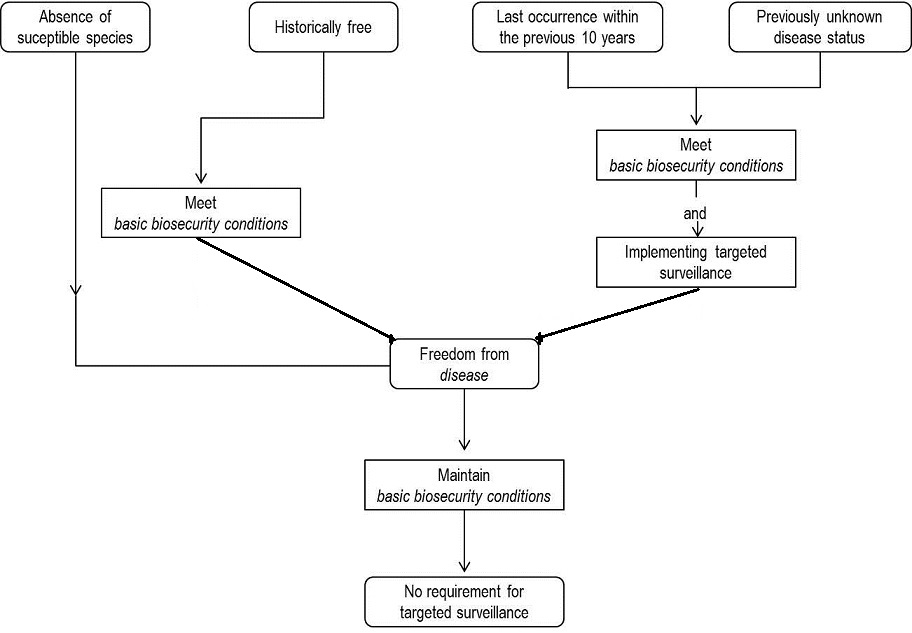
Absence of susceptible species
Unless otherwise specified in the relevant disease chapter, a country, zone or compartment may be recognised as being free from disease without applying targeted surveillance if there are no susceptible species (as listed in the relevant chapter of this Aquatic Manual, or in the scientific literature) present in that country, zone or compartment.
Historically free
Unless otherwise specified in the relevant disease chapter, a country, zone or compartment may be declared free from disease without formally applying a pathogen-specific surveillance programme when:
there has never been a substantiated occurrence of disease reported officially or in the scientific literature (peer reviewed), or
disease has not occurred for at least ten years, provided that the pathogenic agents are likely to produce identifiable clinical signs in observable susceptible animals,
and for at least the past ten years:
the basic biosecurity conditions are in place and effectively enforced;
no vaccination against the disease has been carried out unless otherwise allowed for in the Aquatic Code;
disease is not known to be established in wild aquatic animals within the country or zone intended to be declared free. (A country or zone cannot apply for historical freedom if there is any evidence of disease in wild aquatic animals. However, specific surveillance in wild aquatic animals is not necessary.)
A country, zone or compartment that was self-declared free on the basis of the absence of susceptible species, but subsequently introduces any of the susceptible species as listed in the Aquatic Manual, may be considered historically free from the disease provided that:
the country, zone or compartment of origin was declared free of the disease at the time of introduction;
basic biosecurity conditions were introduced prior to the introduction;
no vaccination against the disease has been carried out unless otherwise allowed for in the disease-specific chapter of this Aquatic Code.
Last occurrence within the previous ten years/previously unknown status
Countries, zones or compartments that have achieved eradication (or in which the disease has ceased to occur) within the previous ten years or where the disease status is unknown, should follow the pathogen-specific surveillance requirements in the Aquatic Manual if they exist. In the absence of disease-specific information to aid the development of a surveillance system, declaration of disease freedom should follow at least two surveys per year (for at least two consecutive years) to be conducted three or more months apart, on the appropriate species, at the appropriate life stage and at times of the year when temperature and season offer the best opportunity to detect the pathogen. Surveys should be designed to provide an overall 95% confidence or greater and with a design prevalence at the animal and higher levels of aggregation (i.e. pond, farm, village, etc.) of 2% or lower (this value may be different for different diseases and may be provided in the disease-specific chapter in the Aquatic Manual). Such surveys should not be based on voluntary submission and should be developed following the recommendations provided in the Aquatic Manual. Survey results will provide sufficient evidence of disease freedom provided that for at least the past ten years these additional criteria are met:
the basic biosecurity conditions are in place and effectively enforced;
no vaccination against the disease has been carried out unless otherwise provided in the Aquatic Code;
disease is not known to be established in wild aquatic animals within the country or zone intended to be declared free. (A country or zone cannot apply for freedom if there is any evidence of disease in wild aquatic animals. Specific surveillance in wild aquatic animals of susceptible species is necessary to confirm absence.)
Maintenance of disease free status
A country or zone that has been declared free from disease following the provisions of the Aquatic Code may discontinue pathogen-specific surveillance while maintaining the disease free status provided that:
if present, the pathogen is likely to produce identifiable clinical signs in observable susceptible species;
the basic biosecurity conditions are in place and effectively enforced;
no vaccination against the disease has been carried out unless otherwise provided in the Aquatic Code;
where applicable, surveillance has previously demonstrated that disease is not present in populations of wild aquatic animal of susceptible species.
A special case can be made for a diseasefree compartment in a country or zone not declared disease free, surveillance should be maintained at a level commensurate with the degree of risk and exposure to potential sources of disease is prevented.
Design of surveillance programmes to demonstrate freedom from disease
A surveillance programme to demonstrate freedom from disease should meet the following requirements in addition to the general requirements for surveillance outlined in this chapter.
Freedom from disease implies the absence of the pathogenic agent in the country, zone or compartment. Scientific methods cannot provide absolute certainty of the absence of disease. Demonstrating freedom from disease involves providing sufficient evidence to demonstrate (to a level of confidence acceptable to Member Countries) that disease with a specified pathogen is not present in a population. In practice, it is not possible to prove (i.e. be 100% confident) that a population is free from disease. Instead, the aim is to provide adequate evidence (to an acceptable level of confidence), that disease, if present, is present in less than a specified proportion of the population (i.e. threshold prevalence).
However, apparent disease at any level in the target population automatically invalidates any freedom from disease claim unless the positive test results are accepted as false positives based on specificity values described in the relevant disease chapter.
The provisions of this Article are based on the principles described above and the following premises:
in the absence of disease and vaccination, the farmed and wild animal populations would become susceptible over a period of time;
the pathogenic agents to which these provisions apply are likely to produce identifiable clinical signs in observable susceptible animals;
to increase the probability of detecting the specific pathogenic agent, the susceptibility of the aquatic animal and the timing of sampling should be under appropriate conditions;
the Aquatic Animal Health Services will be able to investigate, diagnose and report disease, if present;
the appropriate diagnostic method as described in the Aquatic Manual be used;
any claim for the absence of disease over a long period of time in a susceptible population can be substantiated by effective disease investigation and reporting by a Member Country.
Objectives
The objective of this kind of surveillance system is to contribute on an on-going basis evidence to demonstrate freedom from disease in a particular country, zone or compartment with a known confidence and reference to a predetermined design prevalence and diagnostic test characteristics. The level of confidence and the design prevalence will depend on the testing situation, disease and host population characteristics and on the resources available.
A single such survey can contribute evidence adding to an on-going collection of health data. However, single surveys in isolation rarely, if ever, provide sufficient evidence that an aquatic animaldisease is absent and should be augmented with on-going targeted evidence collection (e.g. ongoing disease sampling or passive detection capabilities) to substantiate claims of freedom from disease.
Population
The population of epidemiological units should
be clearly defined. The target population consists
of all individuals of all susceptible species to
the disease in a country, zone or compartment to
which the surveillance results
apply. Sometimes components of the target population are
at higher risk of being the point of introduction for an exotic disease.
In these cases, it is advisable to focus surveillance efforts
on this part of the population, such as farms on a geographical
border.
The design of the survey will depend on the size
and structure of the population being studied. If the population
is relatively small and can be considered to be homogenous with
regards to risk of infection,
a single-stage survey can be used. If different of the same aquaculture establishment do
not share water, they may be considered as epidemiologically separate
populations.
In larger populations where a sampling frame is not available, or when there is a likelihood of clustering of disease, multi-stage sampling is required. In two-stage sampling, at the first stage of sampling, groups of animals (e.g. ponds, farms or villages) are selected. At the second stage, animals are selected for testing from each of the selected groups.
In the case of a complex (e.g. multi-level) population structure, multi-level sampling may be used and the data analysed accordingly.
Sources of evidence
Surveillance data
may originate from a number of different sources, including:
population-based surveys using one or more tests to detect the aetiological agent or evidence of infection;
other non-random sources of data, such as:
sentinel sites;
diseasenotifications and laboratory investigation records;
academic and other scientific studies;
a knowledge of the biology of the agent, including environmental, host population distribution, known geographical distribution, vector distribution and climatic information;
history of imports of potentially infected material;
biosecurity measures in place;
any other sources of information that provide contributory evidence regarding disease in the country, zone or compartment.
The sources of evidence should be fully described. A survey should include a description of the sampling strategy used for the selection of units for testing. For complex surveillance systems, a full description of the system is required including consideration of any biases that may be inherent in the system. Evidence to support claims of freedom from disease can use non-random sources of information provided that, overall, any biases introduced subsequently favour the detection.
Statistical methodology
Analysis of test results from a survey shall be in accordance with the provisions of this chapter and consider the following factors:
the survey design;
the sensitivity and specificity of the test, or test system;
the design prevalence (or prevalences where a multi-stage design is used);
the results of the survey.
Analysis of data for evidence of freedom from infection involves estimating the probability (alpha) that the evidence observed (the results of surveillance) could have been produced under the null hypothesis that infection is present in the population at a specified prevalence(s) (the design prevalences). The confidence in (or, equivalently, the sensitivity of) the surveillance system that produced the evidence is equal to 1–alpha. If the confidence level exceeds a pre-set threshold, the evidence is deemed adequate to demonstrate freedom from infection.
The required level of confidence in the surveillance system
(probability that the system would detect infection if infection were
present at the specified level) should be greater than or equal
to 95%.
The power (probability that the system would
report that no infection is present
if infection is truly
not present) may be set to any value. By convention, this is often
set to 80%, but may be adjusted in accordance with the country’s or zone’s
requirements.
Different statistical methodologies for the calculation of the probability alpha, including both quantitative and qualitative approaches, are acceptable as long as they are based on accepted scientific principles.
The methodology used to calculate the confidence
in the surveillance system
should be scientifically based and clearly documented, including
references to published work describing the methodology.
Statistical analysis of surveillance data often requires assumptions about population parameters or test characteristics. These are usually based on expert opinion, previous studies on the same or different populations, expected biology of the agent, and so on. The uncertainty around these assumptions should be quantified and considered in the analysis (e.g. in the form of prior probability distributions in a Bayesian setting).
For surveillance systems used to demonstrate freedom from specific diseases, calculation of the confidence of a surveillance system is based on the null hypothesis that infection is present in the population. The level of infection is specified by the design prevalence. In the simplest case, this is the prevalence of infection in a homogenous population. More commonly, in the presence of a complex (e.g. multi-level) population structure more than one design prevalence value is required, for instance, the animal-level prevalence (proportion of infected animals in an infected farm) and the group-level prevalence (proportion of infected farms in the country, zone or compartment). Further levels of clustering may be considered, requiring further design prevalence values.
The values for design prevalence used in calculations should be those specified in the relevant disease chapter (if present) of the Aquatic Manual. If not specified for the particular disease, justification for the selection of design prevalence values should be provided, and should be based on the following recommendations:
At the individual animal level, the design prevalence is based on the biology of the infection in the population. It is equal to the minimum expected prevalence of infection in the study population, if the infection had become established in that population. It is dependent on the dynamics of infection in the population and the definition of the study population (which may be defined to maximise the expected prevalence in the presence of infection).
A suitable design prevalence value at the animal level (e.g. prevalence of infected animals in a cage) may be:
between 1% and 5% for infections that are present in a small part of the population e.g. are transmitted slowly or are at the early stages of an outbreak of disease, etc.;
over 5% for highly transmissible infections.
If reliable information, including expert opinion, on the expected prevalence in an infected population is not available, a value of 2% should be used for the design prevalence.
At higher levels (e.g. cage, pond, farm, village, etc.) the design prevalence usually reflects the prevalence of infection that is practically and reasonably able to be detected by a surveillance system. Detection of infection at the lowest limit (a single infected unit in the population) is rarely feasible in large populations. The expected behaviour of the infection may also play a role. Infections that have the ability to spread rapidly between farms may have a higher farm-level design prevalence than slow-moving infections.
A suitable design prevalence value for the first level of clustering (e.g. proportion of infected farms in a zone) is normally not greater than 2%. If a higher design prevalence is selected, it should be justified.
When surveillance data are used to estimate incidence and prevalence measures for the purpose of describing disease occurrence in terms of animal unit, time and place, these measures can be calculated for an entire population and specific time period, or for subsets defined by host characteristics (e.g. age-specific incidence). Incidence estimation requires on-going surveillance to detect new cases while prevalence is the estimated proportion of infected individuals in a population at a given time point. The estimation process should consider test sensitivity and specificity.
Clustering of infection
Infection in a country, zone or compartment usually clusters rather than being uniformly distributed through a population. Clustering may occur at a number of different levels (e.g. a cluster of moribund fish in a pond, a cluster of ponds in a farm, or a cluster of farms in a zone). Except when dealing with demonstrably homogenous populations, surveillance should take this clustering into account in the design and the statistical analysis of the data, at least at what is judged to be the most significant level of clustering for the particular animal population and infection.
Test characteristics
All surveillance involves
performing one or more tests for evidence of the presence of current
or past infection, ranging
from detailed laboratory examinations to farmer observations. The
performance level of a test at the population level is described
in terms of its sensitivity and specificity.
Imperfect sensitivity and/or specificity impact on
the interpretation of surveillance results
and should be taken into account in the analysis of surveillance data. For
example, in the case of a test with imperfect specificity,
if the population is free of disease or has
a very low prevalence of infection,
all or a large proportion of positive tests will be false. Subsequently,
samples that test positive can be confirmed or refuted using a highly
specific test. Where more than one test is used in a surveillance system
(sometimes called using tests in series or parallel), the sensitivity and specificity of
the test combination should be calculated.
All calculations should take the performance level (sensitivity and specificity) of any tests used into account. The values of sensitivity and specificity used for calculations should be specified, and the method used to determine or estimate these values should be documented. Test sensitivity and specificity can be different when applied to different populations and testing scenarios. For example, test sensitivity may be lower when testing carrier animals with low level infections compared to moribund animals with clinical disease. Alternatively, specificity depends on the presence of cross-reacting agents, the distribution of which may be different under different conditions or regions. Ideally, test performance should be assessed under the conditions of use otherwise increased uncertainty exists regarding their performance. In the absence of local assessment of tests, values for sensitivity and/or specificity for a particular test that are specified in the Aquatic Manual may be used but the increased uncertainty associated with these estimates should be incorporated into the analysis of results.
Pooled testing involves the pooling of specimens from multiple individuals and performing a single test on the pool. Pooled testing is an acceptable approach in many situations. Where pooled testing is used, the results of testing should be interpreted using sensitivity and specificity values that have been determined or estimated for that particular pooled testing procedure and for the applicable pool sizes being used. Analysis of the results of pooled testing should, where possible, be performed using accepted, statistically based methodologies, which should be fully documented, including published references.
When applied to a surveillance system, the probabilities of correct assessment of the health status of the epidemiological unit is affected by the entire sampling process, including sample selection, collection, handling and processing, as well as the actual laboratory test performance.
Multiple sources of information
Where multiple different data sources providing evidence of freedom from infection exist, each of these data sources may be analysed accordingly. The resulting estimates of the confidence in each data source may be combined to provide an overall level of confidence for the combined data sources.
The methodology used to combine the estimates from multiple data sources:
should be scientifically valid, and fully documented, including references to published material; and
should, where possible, take into account any lack of statistical independence between different data sources.
Surveillance information gathered from the same country, zone or compartment at different times (e.g. repeated annual surveys) may provide cumulative evidence of animal health status. Such evidence gathered over time may be combined to provide an overall level of confidence. However, a single larger survey, or the combination of data collected during the same time period from multiple random or non-random sources, may be able to achieve the same level of confidence in a shorter period of time.
Analysis of surveillance information gathered intermittently or continuously over time should, where possible, incorporate the time of collection of the information to take into account the decreased value of older information. The sensitivity, specificity and completeness of data from each source should also be taken into account for the final overall confidence level estimation.
Sampling
The objective of sampling from a population is to select a subset of units from the population that is representative of the population with respect to the characteristic of interest (in this case, the presence or absence of infection). The survey design may involve sampling at several levels. For sampling at the level of the epidemiological units or higher units, a formal probability sampling (e.g. simple random sampling) method should be used. Sampling should be carried out in such a way as to provide the best likelihood that the sample will be representative of the population, within the practical constraints imposed by different environments and production systems.
When sampling below the level of the epidemiological unit (e.g. individual animal), the sampling method used should provide the best practical chance of generating a sample that is representative of the population of the chosen epidemiological unit. Collecting a truly representative sample of individual animals (whether from a pond, cage or fishery) is often very difficult. To maximise the chance of finding infection, the aim should be to bias the sampling towards infected animals, e.g. selecting moribund animals, life stages with a greater chance of active infection, etc.
Biased sampling in this context involves sampling
from a defined study population that
has a different probability of infection than
the target population of
which it is a subpopulation.
Once the study population has
been identified, the objective is still to select a representative
sample from this subpopulation.
The sampling method used at all levels should be fully documented and justified.
Sample size
The number of units to be sampled from a population
should be calculated using a statistically valid technique that takes
at least the following factors into account:
the sensitivity and specificity of the diagnostic test, or test system;
the design prevalence (or prevalences where a multi-stage design is used);
the level of confidence that is desired of the survey results.
Additionally, other factors may be considered in sample size calculations, including (but not limited to):
the size of the population (but it is acceptable to assume that the population is infinitely large);
the desired power of the survey;
uncertainty about sensitivity and specificity.
The specific sampling requirements will need
to be tailor-made for each individual disease, taking
into account its characteristics and the specificity and sensitivity of
the accepted testing methods for detecting the pathogenic agent in
host populations.
FreeCalc1.
is a suitable software for the calculation of sample sizes at varying
parameter values. The table below provides examples of sample sizes
generated by the software for a type I and type II error of 5% (i.e.
95% confidence and 95% statistical power). However, this does not
mean that a type 1 and type 2 error of 0.05 should always be used.
For example, using a test with sensitivity and specificity of
99%, 528 units should be sampled. If nine or less of those units
test positive, the population can still be considered free of the disease at
a design prevalence of
2% provided that all efforts are made to ensure that all presumed
false positives are indeed false. This means that there is a 95%
confidence that the prevalence is
2% or lower.
In the case in which the values of Se and Sp are not known (e.g. no information is available in the disease-specific chapter in the Aquatic Manual), they should not automatically be assumed to be 100%. All positive results should be included and discussed in any report regarding that particular survey and all efforts should be made to ensure that all presumed false positives are indeed false.
Quality assurance
Surveys should include a documented quality assurance system, to ensure that field and other procedures conform to the specified survey design. Acceptable systems may be quite simple, as long as they provide verifiable documentation of procedures and basic checks to detect significant deviations of procedures from those documented in the survey design.
| Design prevalence | Sensitivity (%) | Specificity (%) | Sample size | Maximum number of false positive if the population is free |
| 2 | 100 | 100 | 149 | 0 |
| 2 | 100 | 99 | 524 | 9 |
| 2 | 100 | 95 | 1,671 | 98 |
| 2 | 99 | 100 | 150 | 0 |
| 2 | 99 | 99 | 528 | 9 |
| 2 | 99 | 95 | 1,707 | 100 |
| 2 | 95 | 100 | 157 | 0 |
| 2 | 95 | 99 | 542 | 9 |
| 2 | 95 | 95 | 1,854 | 108 |
| 2 | 90 | 100 | 165 | 0 |
| 2 | 90 | 99 | 607 | 10 |
| 2 | 90 | 95 | 2,059 | 119 |
| 2 | 80 | 100 | 186 | 0 |
| 2 | 80 | 99 | 750 | 12 |
| 2 | 80 | 95 | 2,599 | 148 |
| 5 | 100 | 100 | 59 | 0 |
| 5 | 100 | 99 | 128 | 3 |
| 5 | 100 | 95 | 330 | 23 |
| 5 | 99 | 100 | 59 | 0 |
| 5 | 99 | 99 | 129 | 3 |
| 5 | 99 | 95 | 331 | 23 |
| 5 | 95 | 100 | 62 | 0 |
| 5 | 95 | 99 | 134 | 3 |
| 5 | 95 | 95 | 351 | 24 |
| 5 | 90 | 100 | 66 | 0 |
| 5 | 90 | 99 | 166 | 4 |
| 5 | 90 | 95 | 398 | 27 |
| 5 | 80 | 100 | 74 | 0 |
| 5 | 80 | 99 | 183 | 4 |
| 5 | 80 | 95 | 486 | 32 |
| 10 | 100 | 100 | 29 | 0 |
| 10 | 100 | 99 | 56 | 2 |
| 10 | 100 | 95 | 105 | 9 |
| 10 | 99 | 100 | 29 | 0 |
| 10 | 99 | 99 | 57 | 2 |
| 10 | 99 | 95 | 106 | 9 |
| 10 | 95 | 100 | 30 | 0 |
| 10 | 95 | 99 | 59 | 2 |
| 10 | 95 | 95 | 109 | 9 |
| 10 | 90 | 100 | 32 | 0 |
| 10 | 90 | 99 | 62 | 2 |
| 10 | 90 | 95 | 123 | 10 |
| 10 | 80 | 100 | 36 | 0 |
| 10 | 80 | 99 | 69 | 2 |
| 10 | 80 | 95 | 152 | 12 |
Specific requirements for complex non-survey data sources for freedom from disease
Data sources that provide evidence of freedom from infection, but are not based on structured population-based surveys may also be used to demonstrate freedom, either alone or in combination with other data sources. Different methodologies may be used for the analysis of such data sources, but the methodology should comply with the provisions of this chapter. The approach used should, where possible, also take into account any lack of statistical independence between observations.
Analytical methodologies based on the use of step-wise probability estimates to describe the surveillance system may determine the probability of each step either by:
the analysis of available data, using a scientifically valid methodology; or where no data are available,
the use of estimates based on expert opinion, gathered and combined using a formal, documented and scientifically valid methodology.
Where there is significant uncertainty and/or variability in estimates used in the analysis, stochastic modelling or other equivalent techniques should be used to assess the impact of this uncertainty and/or variability on the final estimate of confidence.
Surveillance for distribution and occurrence of disease
Surveillance to determine distribution and occurrence of disease or of other relevant health related events is widely used to assess the prevalence and incidence of selected disease as an aid to decision-making, for example implementation of control and eradication programmes. It also has relevance for the international movement of animals and products when movement occurs among infected countries.
In contrast to surveillance to demonstrate freedom from disease, surveillance for the distribution and occurrence of disease is usually designed to collect data about a number of variables of animal health relevance, for example:
prevalence or incidence of disease in wild or cultured animals;
morbidity and mortality rates;
frequency of disease risk factors and their quantification;
frequency distribution of variables in epidemiological units;
frequency distribution of the number of days elapsing between suspicion of disease and laboratory confirmation of the diagnostic and/or to the adoption of control measures;
farm production records, etc.
This article describes surveillance to estimate parameters of disease occurrence.
Objectives
The objective of this kind of surveillance system is to contribute on an on-going basis evidence to assess the occurrence and distribution of disease or infection in a particular country, zone or compartment. This will provide information for domestic disease control programmes and relevant disease occurrence information to be used by trading partners for qualitative and quantitative risk assessment.
A single such survey can contribute evidence adding to an on-going collection of health data.
Population
The population of epidemiological units should be clearly defined. The target population consists of all individuals of all species susceptible to the disease in a country, zone or compartment to which the surveillance results apply. Some local areas within a region may be known to be free of the disease of concern, allowing resources to be concentrated on known positive areas for greater precision of prevalence estimates and only verification of expected 0 prevalence areas.
The design of the survey will depend on the size and structure of the population being studied. If the population is relatively small and can be considered to be homogenous with regards to risk of infection, a single-stage survey can be used.
In larger populations where a sampling frame is not available, or when there is a likelihood of clustering of disease, multi-stage sampling is required. For example, a multi-stage sampling process may involve sampling of farms or villages followed by sampling of fish from selected ponds within the sampled farms/villages.
In the case of a complex (e.g. multi-level) population structure, multi-level sampling may be used and the data analysed accordingly.
Sources of evidence
Surveillance data may originate from a number of different sources, including:
population-based surveys using one or more tests to detect the agent;
other non-random sources of data, such as:
sentinel sites;
diseasenotifications and laboratory investigation records;
academic and other scientific studies;
a knowledge of the biology of the agent, including environmental, host population distribution, known geographical distribution, vector distribution and climatic information;
history of imports of potentially infected material;
biosecurity measures in place;
any other sources of information that provide contributory evidence regarding disease or infection in the country, zone or compartment.
The sources of evidence should be fully described. In the case of a A structured survey, this should include a description of the sampling strategy used for the selection of units for testing. For complex surveillance systems, a full description of the system is required including consideration of any biases that may be inherent in the system. Evidence to support changes in prevalence/incidence of endemic disease should be based on valid, reliable methods to generate precise estimates with known error.
Statistical methodology
Analysis of survey data should be in accordance with the provisions of this chapter and should consider the following factors:
the survey design;
the sensitivity and specificity of the test, or test system;
the results of the survey.
For surveillance systems
used to describe disease patterns, the purpose is to estimate prevalence or incidence with
confidence intervals or probability intervals. The magnitude of
these intervals expresses the precision of the estimates and is
related to sample size. Narrow intervals are desirable but will
require larger sample sizes and more dedication of resources. The
precision of the estimates and the power to detect differences in prevalence between populations
or between time points depends not only on sample size, but also
on the actual value of the prevalence in
the population or the actual difference. For this reason, when designing
the surveillance system,
a prior estimate/assumption of expected prevalence or
expected difference in prevalence should
be made.
For the purpose of describing disease occurrence,
measures of animal unit, time and place can be calculated for an
entire population and specific time period, or for subsets defined
by host characteristics (e.g. age-specific incidence). Incidence estimation
requires on-going surveillance to
detect new cases in a specified
time period while prevalence is
the estimated proportion of infected individuals in a population
at a given time point. The estimation process should consider test sensitivity and specificity.
Statistical analysis of surveillance data often requires assumptions about population parameters or test characteristics. These are usually based on expert opinion, previous studies on the same or different populations, expected biology of the agent, information contained in the disease-specific chapter of the Aquatic Manual, and so on. The uncertainty around these assumptions should be quantified and considered in the analysis (e.g. in the form of prior probability distributions in a Bayesian setting).
When surveillance objectives are to estimate prevalence/incidence or changes in disease patterns, statistical analysis should account for sampling error. Analytic methods should be thoroughly considered and consultation with biostatistician/quantitative epidemiologist consulted beginning in the planning stages and continued throughout the programme.
Clustering of infection
Infection in a country, zone or compartment usually clusters rather than being uniformly distributed through a population. Clustering may occur at a number of different levels (e.g. a cluster of moribund fish in a pond, a cluster of ponds in a farm, or a cluster of farms in a zone). Except when dealing with demonstrably homogenous populations, surveillance should take this clustering into account in the design and the statistical analysis of the data, at least at what is judged to be the most significant level of clustering for the particular animal population and infection. For endemic diseases, it is important to identify characteristics of the population which contribute to clustering and thus provide efficiency in disease investigation and control.
Test characteristics
All surveillance involves performing one or more tests for evidence of the presence of current or past infection, ranging from detailed laboratory examinations to farmer observations. The performance level of a test at the population level is described in terms of its sensitivity and specificity. Imperfect sensitivity and/or specificity impact on the interpretation of surveillance results and should be taken into account in the analysis of surveillance data. For example, in populations with low prevalence of infection, a large proportion of positive tests may be false unless the tests used have perfect specificity. To ensure detection in such instances, a highly sensitive test is frequently used for initial screening and then confirmed with highly specific tests.
All calculations should take the performance level (sensitivity and specificity) of any tests used into account. The values of sensitivity and specificity used for calculations should be specified, and the method used to determine or estimate these values should be documented. Test sensitivity and specificity can be different when applied to different populations and testing scenarios. For example, test sensitivity may be lower when testing carrier animals with low level infections compared to moribund animals with clinical disease. Alternatively, specificity depends on the presence of cross-reacting agents, the distribution of which may be different under different conditions or regions. Ideally, test performance should be assessed under the conditions of use otherwise increased uncertainty exists regarding their performance. In the absence of local assessment of tests, values for sensitivity and/or specificity for a particular test that are specified in the Aquatic Manual may be used but the increased uncertainty associated with these estimates should be incorporated into the analysis of results.
Pooled testing involves the pooling of specimens from multiple individuals and performing a single test on the pool. Pooled testing is an acceptable approach in many situations. Where pooled testing is used, the results of testing should be interpreted using sensitivity and specificity values that have been determined or estimated for that particular pooled testing procedure and for the applicable pool sizes being used. Analysis of the results of pooled testing should, where possible, be performed using accepted, statistically based methodologies, which should be fully documented, including published references.
Test results from surveillance for endemic disease will provide estimates of apparent prevalence (AP). Using diagnostic sensitivity (DSe) and diagnostic specificity (DSp), true prevalence (TP) should be calculated with the following formula:
TP = (AP + DSp - 1)/(DSe + DSp - 1)
In addition, it should be remembered that different laboratories may obtain conflicting results for various tests, host, or procedure-related reasons. Therefore, sensitivity and specificity parameters should be validated for the particular laboratory and process.
Multiple sources of information
Where multiple different data sources providing information on infection or disease are generated, each of these data sources may be analysed and presented separately.
Surveillance information gathered from the same country, zone or compartment at different times and similar methodology (e.g. repeated annual surveys) may provide cumulative evidence of animal health status and changes. Such evidence gathered over time may be combined (e.g. using Bayesian methodology) to provide more precise estimates and details of disease distribution within a population.
Apparent changes in disease occurrence of endemic diseases may be real or due to other factors influencing detection proficiency.
Sampling
The objective of sampling from a population is to select a subset of units from the population that is representative of the population with respect to the characteristic of interest (in this case, the presence or absence of infection). The survey design may involve sampling at several levels. For sampling at the level of the epidemiological units or higher units, a formal probability sampling (e.g. simple random sampling) method should be used. Sampling should be carried out in such a way as to provide the best likelihood that the sample will be representative of the population, within the practical constraints imposed by different environments and production systems.
When sampling below the level of the epidemiological unit (e.g. individual animal), the method used should be probability-based sampling. Collecting a true probability-based sample is often very difficult and care should therefore be taken in the analysis and interpretation of results obtained using any other method, the danger being that inferences could not be made about the sampled population.
The sampling method used at all levels should be fully documented and justified.
Sample size
The number of units to be sampled from a population should be calculated using a statistically valid technique that takes at least the following factors into account:
the sensitivity and specificity of the diagnostic test (single or in combination);
expected prevalence or incidence in the population (or prevalences/incidences where a multi-stage design is used);
the level of confidence that is desired of the survey results;
the precision desired (i.e. the width of the confidence or probability intervals).
Additionally, other factors may be considered in sample size calculations, including (but not limited to):
the size of the population (but it is acceptable to assume that the population is infinitely large);
uncertainty about sensitivity and specificity.
The specific sampling requirements will need to be tailor-made for each individual disease, taking into account its characteristics and the specificity and sensitivity of the accepted testing methods for detecting the pathogenic agent in host populations.
A number of software packages, e.g. Survey Tool Box (www.aciar.gov.au; www.ausvet.com.au), WinPEPI (www.sagebrushpress.com/pepibook.html) can be used for the calculation of sample sizes.
In the case in which the values of Se and Sp are not known (e.g. no information is available in the disease-specific chapter in the Aquatic Manual), they should not automatically be assumed to be 100%. Assumed values should be produced in consultation with subject-matter experts.
Quality assurance
Surveys should include a documented quality assurance system, to ensure that field and other procedures conform to the specified survey design. Acceptable systems may be quite simple, as long as they provide verifiable documentation of procedures and basic checks to detect significant deviations of procedures from those documented in the survey design.
Examples of surveillance programmes
The following examples describe surveillance systems
and approaches to the analysis of evidence for demonstrating freedom
from disease. The purpose
of these examples is:
to illustrate the range of approaches
that may be acceptable;
to provide practical guidance and models
that may be used for the design of specific surveillance systems;
and
to provide references to available resources that are useful in the development and analysis of surveillance systems.
While these examples demonstrate ways in which
freedom from disease may be
successfully demonstrated, they are not intended to be prescriptive.
Countries are free to use different approaches, as long as they
meet the requirements of this chapter.
The examples deal with the use of surveys and are designed to illustrate different survey designs, sampling schemes, the calculation of sample size, and analysis of results. It is important to note that alternative approaches to demonstrating freedom using complex non-survey-based data sources are also currently being developed and may soon be published2..
Example 1. – One-stage
structured survey (farm certification)
Context
A freshwater aquaculture industry
raising fish in tanks has established a farm certification scheme.
This involves demonstrating farm-level freedom from a particular
(hypothetical) disease (Disease X). The disease does
not spread very quickly, and is most common during the winter months,
with adult fish at the end of the production cycle being most severely
affected. Farms consist of a number of grow-out tanks, ranging from 2 to 20,
and each tank holds between 1,000 and 5,000 fish.
Objective
The objective is to implement surveillance that is capable of providing evidence that an individual farm is free from Disease X. (The issue of national or zone freedom, as opposed to farm freedom, is considered in the next example.)
Approach
The accreditation scheme establishes a set of
standard operating procedures and requirements for declaration of
freedom, based on the recommendations given in this chapter. These
require farms to undertake a survey capable of producing 95% confidence
that the disease would
be detected if it were present. Once farms have been surveyed without
detecting disease, they
are recognised as free, as long as they maintain a set of minimum biosecurity standards.
These standards are designed to prevent the introduction of Disease
X into the farm (through the implementation of controls specific
to the method of spread of that disease) and to
ensure that the disease would
be detected rapidly if it were to enter the farm (based on evidence
of adequate health record keeping and the prompt investigation of
unusual disease events).
The effective implementation of these biosecurity measures
is evaluated with annual on-farm audits conducted by independent
auditors.
Survey standards
Based on the recommendations given in this chapter,
a set of standards are established for the conduct of surveys to
demonstrate freedom from infection with
causative agent of Disease X. These standards include:
The level of confidence required
of the survey is 95% (i.e. Type I error = 5%).
The power of the survey is arbitrarily set at 95% (i.e. Type II error = 5%, which means that there is a 5% chance of concluding that a non-diseased farm is infected).
The target population is
all the fish on the farm. Due to the patterns of disease in
this production system, in which only fish in the final stages of
grow-out, and only in winter are affected, the study population is defined
as grow-out fish during the winter months.
The issue of clustering is considered. As
fish are grouped into tanks, this is the logical level at which
to consider clustering. However, when a farm is infected, the disease often
occurs in multiple tanks, so there is little evidence of strong
clustering. Also, the small number of tanks on a single farm means
that it is difficult to define a design prevalence at
the tank level (i.e. the proportion of infected tanks that the survey
should be able to detect on the farm). For these reasons, it is
decided to treat the entire grow-out population of each farm as
a single homogenous population.
Stratification is also considered. In order
to ensure full representation, it is decided to stratify the sample size
by tank, proportional to the population of each tank.
The design prevalence at
the animal level is determined based on the epidemiology of the disease.
The disease does not
spread quickly; however, in the defined target population,
it has been reported to affect at least 10% of fish if the population
is infected. In order to take the most conservative approach, an arbitrarily
low design prevalence of
2% is used. A prevalence of
10% may have been used (and would result in a much smaller sample
size), but the authorities were not convinced by the thought that
the population could still be infected at a level of say 5%, and disease still
not be detected.
The test used involves destructive sampling of the fish, and is based on an antigen-detection enzyme-linked immunosorbent assay (ELISA). Disease X is present in some parts of the country (hence the need for a farm-level accreditation programme). This has provided the opportunity for the sensitivity and the specificity of the ELISA to be evaluated in similar populations to those on farms. A recent study (using a combination of histology and culture as a gold standard) estimated the sensitivity of the ELISA to be 98% (95% confidence interval 96.7–99.2%), and the specificity to be 99.4% (99.2–99.6%). Due to the relatively narrow confidence intervals, it was decided to use the point estimates of the sensitivity and specificity rather than complicate calculations by taking the uncertainty in those estimates into account.
Sample size
The sample size required to meet the objectives
of the survey is calculated to take the population size, the test
performance, the confidence required and the design prevalence into
account. As the population of each farm is relatively large, differences
in the total population of each farm have little effect on the calculated sample
size. The other parameters for sample size calculation are fixed
across all farms. Therefore, a standard sample size (based on the
use of this particular ELISA, in this population) is calculated.
The sample size calculations are performed using the FreeCalc software.
Based on the parameters listed above, the sample size required is
calculated to be 410 fish per farm. In addition, the programme calculates
that, given the imperfect specificity, it
is still possible for the test to produce up to five false-positive
reactors from an uninfected population using this sample size. The
authorities are not comfortable with dealing with false-positive
reactors, so it is decided to change the test system to include
a confirmatory test for any positive reactors. Culture is selected
as the most appropriate test, as it has a specificity that
is considered to be 100%. However, its sensitivity is
only 90% due to the difficulty of growing the organism.
As two tests are now being used, the performance of the test system should be calculated, and the sample size recalculated based on the test system performance.
Using this combination of tests (in which a sample is considered positive only if it tests positive to both tests), the specificity of the combined two tests can be calculated by the formula:
Spcombined = Sp1 Sp2 - (Sp11 x Sp2)
which produces a combined specificity of 1 + 0.994 – (1 × 0.994) = 100%.
The sensitivity may be calculated by the formula:
Specombined = Se1 x Se
which produces a combined sensitivity of 0.9 × 0.98 = 88.2%.
These new values are used to calculate the survey sample size yielding a result of 169 fish. It is worth noting that attempts to improve the performance of a test (in this case increase specificity) generally result in a decrease in the performance of the other aspect of the test performance (sensitivity in this example). However, in this case, the loss of sensitivity is more than compensated for by the decreased sample size due to the improved specificity.
It is also worth noting that, when using a test
system with 100% specificity, the
effective power of the survey will always be 100%, regardless of
the figure used in the design. This is because it is not possible
to make a Type II error, and conclude that the farm is infected
when it is not.
A check of the impact of population size on the calculated sample size is worthwhile. The calculated sample size is based on an infinitely large population. If the population size is smaller, the impact on sample size is shown in the following table:
| Population size | Sample size |
| 1,000 | 157 |
| 2,000 | 163 |
| 5,000 | 166 |
| 10,000 | 169 |
Based on these calculations, it is clear
that, for the population sizes under consideration, there is little
effect on the sample size. For the sake of simplicity, a standard
sample size of 169 is used, regardless of the number of grow-out
fish on the farm.
Sampling
The selection of individual fish to include in
the sample should be done in such a manner as to give the best chance
of the sample being representative of the study population.
A fuller description of how this may be achieved under different
circumstances is provided in Survey Toolbox3.. An example of a single farm will
be used to illustrate some of the issues.
One farm has a total of eight tanks, four of
which are used for grow-out. At the time of the survey (during winter),
the four grow-out tanks have 1,850, 4,250, 4,270 and 4,880 fish,
respectively, giving a total population of 15,250 grow-out fish.
Simple random sampling from this entire population
is likely to produce sample sizes from each tank roughly in proportion
to the number of fish in each tank. However, proportional stratified
sampling will guarantee that each tank is represented in proportion.
This simply involves dividing the sample size between tanks in proportion
to their population. The first tank has 1,850 fish out of a total
of 15,250, representing 12.13%. Therefore 12.13% of the sample (21 fish)
should be taken from the first tank. Using a similar approach the sample
size for the other three tanks is 47, 47 and 54 fish, respectively.
Once the sample for each tank is determined,
the problem remains as to how to select 21 fish from a tank of 1,850
so that they are representative of the population. Several options
exist.
If the fish can be handled
individually, random systematic sampling may be used. For example,
samples can be collected at harvest or during routine management
activities involving handling the fish (such as grading or vaccination).
If fish are handled, systematic sampling simply
involves selecting a fish at regular intervals. For instance, to
select 21 from 1,850, the sampling interval should be 1,850/21 = 88.
This means that every 88th fish from the tank should be sampled.
To ensure randomness, it is good practice to use a random number between 1
and 88 (in this case) to select the first fish (e.g. using a random
number table), and then select every 88th fish after that.
If fish cannot be handled individually (by
far the most common, and more difficult, circumstance) then the
fish to be sampled should be captured from the tanks. Fish should
be captured in the most efficient and practical way possible; however,
every effort should be made to try to ensure that the sample is representative.
In this example, a dip net is the normal method used for capturing
fish. Using a dip net, convenience sampling would involve capturing
21 fish by repeatedly dipping at one spot and capturing the easiest
fish (perhaps the smaller ones). This approach is strongly discouraged.
One method of increasing the representativeness is to sample at
different locations in the tank – some at one end, some at either
side, some at the other end, some in the middle, some close to the
edge. Additionally, if there are differences among the fish, an
attempt should be made to capture fish in such a way as to give different
groups of fish a chance of being caught (i.e. do not just try to
catch the small ones, but include big ones as well).
This method of collecting a sample is far from the ideal of random sampling, but due to the practical difficulties of implementing random sampling of individual fish, this approach is acceptable, as long as the efforts made to increase the representativeness of the sample are both genuine and fully documented.
Testing
Specimens are collected, processed and tested in accordance with standardised procedures developed under the certification programme and designed to meet the requirements of the Aquatic Manual. The testing protocol dictates that any specimens that test positive to ELISA be submitted for culture, and that any positive culture results indicate a true positive specimen (i.e. that the farm is not free from disease). It is important that this protocol be adhered to exactly. If a positive culture is found, then it is not acceptable to retest it, unless further testing is specified in the original testing protocol, and the impact of such testing accounted for in the test system sensitivity and specificity estimates (and therefore the sample size).
Analysis
If the calculated sample size of 169 is used,
and no positive reactors are found, then the survey will have a confidence
of 95%. This can be confirmed by analysing the results using the
FreeCalc software mentioned above (which reports a confidence level
of 95.06%).
It may happen in some cases that the survey is
not conducted exactly as planned, and the actual sample size is
less than the target sample size. However, the size of the farm
may also be smaller. In these cases, it is advisable to analyse
the farm data on a farm-by-farm basis. For example, if only 165 specimens
were collected from a farm with only 2,520 fish, the resulting confidence
would still be 95%. If only 160 fish were collected, the confidence
is only 94.5%. If a rigid target of 95% confidence is used, then
this survey would fail to meet that target and more evidence would
be required.
Example 2 – Two-stages structured survey
(national freedom)
Context
A country aims to declare freedom from Disease Y of crustaceans. The industry in this country is based largely on small-holder ponds, grouped closely together in and around villages. The disease is reasonably highly contagious, and causes mass mortality mid to late in the production cycle, with affected animals becoming moribund and dying in a matter of days. Affected animals show few characteristic signs, but an infected pond will almost invariably break down with mass mortality unless harvested beforehand. It is more common in late summer, but can occur at any time of year. It also occurs occasionally early in the production cycle. In this country, there are some limitations to the availability of laboratory facilities and the transport infrastructure. However, there is a relatively large government structure, and a comprehensive network of fisheries officers.
Objective
The objective is to establish national freedom from Disease Y. The surveillance system should meet the requirements of this chapter, but should also be able to be practically implemented in this small-holder production system.
Approach
The aquaculture authorities decide to use a survey to gather evidence of freedom, using a two-stage survey design (sampling villages at the first level, and ponds at the second). Laboratory testing of specimens from a large number of farms is not considered feasible, so a combined test system is developed to minimise the need for expensive laboratory tests.
The unit of observation and analysis is, in this case, the pond, rather than the individual animal. This means that the diagnostic is being made at the pond level (an infected pond or a non-infected pond) rather than at the animal level.
The survey is therefore a survey to demonstrate that no villages are infected (using a random sample of villages and making a village-level diagnostic). The test used to make a village-level diagnostic is, in fact, another survey, this time to demonstrate that no ponds in the village are affected. A test is then performed at the pond level (farmer observation followed, if necessary, by further laboratory testing).
Survey standards
The confidence to be achieved by the survey is 95%. The power is set at 95% (but is likely to be virtually 100% if the test system used achieves nearly 100% specificity, as demonstrated in the previous example).
The target population is all ponds stocked with shrimp in the country during the study period. The study population is the same, except that those remote areas to which access is not possible are excluded. As outbreaks can occur at any time of year, and at any stage of the production cycle, it is decided not to further refine the definition of the population to target a particular time or age.
Three tests are used. The first is farmer observation, to determine if mass mortality is occurring in a particular pond. If a pond is positive to the first test (i.e. mass mortality is detected), a second test is applied. The second test used is polymerase chain reaction (PCR). Cases positive to PCR are further tested using transmission experiments.
Farmer observation can be treated as a test just like any other. In this case, the observation of mass mortality is being used as a test for the presence of Disease Y. As there are a variety of other diseases that are capable of causing mass mortality, the test is not very specific. On the other hand, it is quite unusual for Disease Y to be present, and not result in mass mortality, so the test is quite sensitive. A standard case definition is established for mass mortality’ (for instance, greater than 20% of the pond’s population of shrimp observed dead in the space of less than one week). Based on this definition, farmers are able to ‘diagnose’ each pond as having mass mortality. Some farmers may be over-sensitive and decide that mass mortality is occurring when only a small proportion of shrimp are found dead (false positives, leading to a decrease in specificity) while a small number of others fail to recognise the mortalities, decreasing sensitivity.
In order to quantify the sensitivity and specificity of farmer observation of mass mortalities, as a test for Disease Y, a separate study is carried out. This involves both a retrospective study of the number of mass mortality events in a population that is thought to be free from disease, as well as a study of farmers presented with a series of mortality scenarios, to assess their ability to accurately identify a pond with mass mortality. By combining these results, it is estimated that the sensitivity of farmer-reported mass mortalities as a test for Disease Y is 87% while the specificity is 68%.
When a farmer detects a pond with mass mortality, specimens are collected from moribund shrimp following a prescribed protocol. Tissue samples from 20 shrimp are collected, and pooled for PCR testing. In the laboratory, the ability of pooled PCR to identify a single infected animal in a pool of 20 has been studied, and the sensitivity of the procedure is 98.6%. A similar study of negative specimens has shown that positive results have occasionally occurred, probably due to laboratory contamination, but maybe also because of the presence of non-viable genetic material from another source (shrimp-based feed stuffs are suspected). The specificity is therefore estimated at 99%.
Published studies in other countries have
shown that the sensitivity of
transmission tests, the third type of test to be used, is 95%, partly
due to variability in the load of the agent in inoculated material.
The specificity is
agreed to be 100%.
Based on these figures, the combined test system sensitivity and specificity are calculated using the formulae presented in Example 1, first with the first two tests, and then with the combined effect of the first two tests and the third test. The result is a sensitivity of 81.5% and a specificity of 100%.
The design prevalence should
be calculated at two levels. First, the pond-level design prevalence (the proportion
of ponds in a village that would be infected if disease were
present) is determined. In neighbouring infected countries, experience
has shown that ponds in close contact with each other are quickly
infected. It is unusual to observe an infected village with fewer
than 20% of ponds infected. Conservatively, a design prevalence of
5% is used. The second value for design prevalence applies
at the village level, or the proportion of infected villages that
could be identified by the survey. As it is conceivable that the infection may
persist in a local area without rapid spread to other parts of the country,
a value of 1% is used. This is considered to be the lowest design prevalence value
for which a survey can be practically designed.
The population of villages in the country
is 65,302, in accordance with official government records. Those
with shrimp ponds number 12,890, based on records maintained by
the aquaculture authorities. These
are generated through a five-yearly agricultural census, and updated
annually based on reports of fisheries officers. There are no records
available of the number of ponds in each of these villages.
Sample size
Sample size is calculated for the two levels
of sampling, first the number of villages to be sampled and then the
number of ponds to be sampled. The number of villages to be sampled
depends on the sensitivity and
the specificity of
the test used to classify villages as infected or not infected.
As the ‘test’ used in each village is really just another survey,
the sensitivity is
equal to the confidence and the specificity is
equal to the power of the village-level survey. It is possible to
adjust both confidence and power by changing the sample size in
the village survey (number of ponds examined), which means that
we can determine, within certain limits, what sensitivity and specificity we
achieve.
This allows a flexible approach to sample size
calculation. If a smaller first-stage sample size is desired (a small
number of villages), a high sensitivity and specificity are
needed, which means that the number of ponds in each village that
need to be examined is larger. A smaller number of ponds will result
in lower sensitivity and specificity,
requiring a larger number of villages. The approach to determining
the optimal (least cost) combination of first- and second-stage
sample sizes is described in Survey Toolbox.
A further complication is presented by the fact
that each village has a different number of ponds. In order to achieve
the same (or similar) confidence and power (sensitivity and specificity)
for each village, a different sample size may be required. The authorities
choose to produce a table of sample sizes for the number of ponds
to sample in each village, based on the total ponds in each village.
An example of one possible approach to determining the sample size follows:
The target sensitivity (confidence) achieved by each village-level survey is 95%. The target specificity is 100%. Using the FreeCalc software, with a design prevalence of 1% (the survey is able to detect disease if 1% or more villages are infected), the first-stage sample size is calculated as 314 villages. Within each village, the test used is the combined test system described above with a sensitivity of 81.5% and a specificity of 100%. Based on these figures the following table is developed, listing the number of ponds that need to be sampled in order to achieve 95% sensitivity.
Sampling
First-stage sampling (selection of villages)
is done using random numbers and a sampling frame based on the fisheries
authorities list of villages with shrimp ponds. The villages are
listed on a spreadsheet with each village numbered from 1 to 12,890.
A random number table (such as that included in Survey Toolbox)
or software designed for the generation of random numbers (such
as EpiCalc4.) is used.
| Population | Sample size |
| 30 | 29 |
| 40 | 39 |
| 60 | 47 |
| 80 | 52 |
| 100 | 55 |
| 120 | 57 |
| 140 | 59 |
| 160 | 61 |
| 180 | 62 |
| 200 | 63 |
| 220 | 64 |
| 240 | 64 |
| 260 | 65 |
| 280 | 65 |
| 300 | 66 |
| 320 | 66 |
| 340 | 67 |
| 360 | 67 |
| 380 | 67 |
| 400 | 67 |
| 420 | 68 |
| 440 | 68 |
| 460 | 68 |
| 480 | 68 |
| 500 | 68 |
| 1,000 | 70 |
The second stage of sampling involves random selection of ponds within each village. This requires a sampling frame, or list of each pond in the village. The fisheries authorities use trained local fisheries officers to coordinate the survey. For each selected village, the officer visits the village and convenes a meeting of all shrimp farmers. At the meeting, they are asked how many ponds they have and a list of farmers’ names and the number of ponds is compiled. A simple random sample of the appropriate number of ponds (between 29 and 70, from the table above, depending on the number of ponds in the village) is selected from this list. This is done either using software (such as Survey Toolbox’s Random Animal Programme), or manually with a random number table or decimal dice for random number selection. Details of this process are described in Survey Toolbox. This selection process identifies a particular pond in terms of the name of the owner, and the sequence number amongst the ponds owned (e.g. Mr Smith’s 3rd pond). Identification of the actual pond is based on the owners own numbering system for the ponds.
Testing
Once ponds have been identified, the actual survey consists of ‘testing those ponds’. In practice, this involves the farmers observing the ponds during one complete production cycle. The local fisheries officer makes weekly visits to each farmer to check if any of the selected ponds have suffered mass mortality. If any are observed (i.e. the first test is positive), 20 moribund shrimp are collected for laboratory examination (first PCR, and then, if positive, transmission experiments).
Analysis
Analysis is performed in two stages. First, the results from each village are analysed to ensure that they meet the required level of confidence. If the target sample size is achieved (and only negative results obtained), the confidence should be 95% or greater in each village. At the second stage, the results from each village are analysed to provide a country level of confidence. Again, if the target sample size (number of villages) is achieved, this should exceed 95%.
Example 3. – Spatial sampling and the use of tests with imperfect specificity
Context
A country has an oyster culture industry, based primarily on rack culture of oysters in 23 estuaries distributed along the coastline. In similar regions in other countries, Disease Z causes mortalities in late summer/early autumn. During an outbreak a high proportion of oysters are affected; however, it is suspected that the agent may be present at relatively low prevalence in the absence of diseaseoutbreaks.
Objective
The national authorities wish to demonstrate national freedom from Disease Z. If the disease should be detected, a secondary objective of the survey is to collect adequate evidence to support zoning at the estuary level.
Approach
The authorities conclude that clinical surveillance for disease outbreaks is
inadequate because of the possibility of low level subclinical infections.
It is therefore decided to base surveillance on
a two-stage survey, in which sampled oysters are subjected to laboratory
testing. The first stage of the survey is the selection of estuaries.
However, due to the objective of providing evidence for zoning (should
disease be found in any of the estuaries), it is decided to use
a census approach and sample every estuary. In essence this means
that there will be 23 separate surveys, one for each estuary. A
range of options for sampling oysters are considered, including
sampling at harvest or marketing, or using farms (oyster leases)
as a level of sampling or stratification. However, the peak time
of activity of the agent does not correspond to the harvest period,
and the use of farms would exclude the significant numbers of wild
oysters present in the estuaries. It is therefore decided to attempt
to simulate simple random sampling from the entire oyster population
in the estuary, using a spatial sampling approach.
Survey standards
The target population is all of the oysters in each of the estuaries. The study population is the oysters present during the peak disease-risk period in late summer early autumn. Wild and cultured oysters are both susceptible to disease, and may have associated with them different (but unknown) risks of infection. They are therefore both included in the study population. As will be described below, sampling is based on mapping. Therefore the study population can more accurately be described as that population falling within those mapped areas identified as oyster habitats.
A design prevalence value is only required at the oyster level (as a census is being used at the estuary level). While the disease is often recognised with a very high prevalence during outbreaks, a low value is used to account for the possibility of persistence of the agent in the absence of clinical signs. A value of 2% is selected.
The test used is histopathology with immuno-staining techniques. This test is known to produce occasional false-positive results due to nonspecific staining, but is very sensitive. Published studies indicate values of 99.1% for sensitivity and 98.2% for specificity. No other practical tests are available. This means that it is not possible to definitively differentiate false positives from true positives, and that in a survey of any size, a few false positives are expected (i.e. 1.8%).
The confidence is set at 95% and the power at 80%. In the previous examples, due to the assumed 100% specificity achieved by use of multiple tests, the effective power was 100%. In this case, with imperfect specificity, there will be a risk of falsely concluding that a healthy estuary is infected, so the power is not 100%. The choice of a relatively low figure (80%) means that there is a one in five chance of falsely calling an estuary infected when it is not infected, but it also dramatically decreases the survey costs, through a lower sample size.
Sample size
Based on the assumption that the sampling procedure will mimic simple random sampling, the sample size (number of oysters to sample per estuary) can be calculated with FreeCalc. The population size (number of oysters per estuary) is assumed to be very large. The calculated sample size, using the sensitivity, specificity and design prevalence figures given above, is 450. FreeCalc also reports that, based on this sample size and the specificity of the test, it is possible to get ten or fewer false-positive test results, and still conclude that the population is free from disease. This is because, if the population were infected at 2% or greater, the anticipated number of positive reactors from a sample of 450 would be greater than 10. In fact, we would expect 9 true positives (450 × 2% × 99.1%) and 8 false positives (450 × 98% × 1.8%) or a total of 17 positives if the population were infected at a prevalence of 2%.
This illustrates how probability theory and adequate sample size can help differentiate between true- and false-positive results when there is no alternative but to use a test with imperfect specificity.
Sampling
The aim is to collect a sample of 450 oysters that represent an entire estuary. Simple random sampling depends on creating a sampling frame listing every oyster (not possible) and systematic sampling depends on being able to (at least conceptually) line up all the oysters (again, not possible). The authorities decide to use spatial sampling to approximate simple random sampling. Spatial sampling involves selecting random points (defined by coordinates), and then selecting oysters near the selected points. In order to avoid selecting many points with no oysters nearby, the estuary is first mapped (the fisheries authorities already have digital maps defining oyster leases available). To these maps areas with significant concentrations of wild oysters are also added, based on local expertise. Pairs of random numbers are generated such that the defined point falls within the defined oyster areas. Other schemes are considered (including using a rope marked at regular intervals, laid out on a lease to define a transect, and collecting an oyster adjacent to each mark on the rope) but the random coordinate approach is adopted.
Survey then visit each point by boat (using a GPS Global Positioning System unit to pinpoint the location). A range of approaches is available for selecting which oyster to select from a densely populated area, but it should involve some effort at randomness. Survey staff opt for a simple approach: when the GPS receiver indicates that the site has been reached, a pebble is tossed in the air and the oyster closest to the point where it lands is selected. Where oysters are arranged vertically (e.g. wild oysters growing up a post), a systematic approach is used to determine the depth of the oyster to select. First, an oyster at the surface, next, an oyster halfway down, and thirdly, an oyster as deep as can be reached from the boat.
This approach runs the risk of bias towards lightly populated areas, so an estimate of the relative density of oysters at each sampling point is used to weight the results (see Survey Toolbox for more details).
Testing
Specimens are collected, processed, and analysed following a standardised procedure. The results are classified as definitively positive (showing strong staining in a highly characteristic pattern, possibly with associated signs of tissue damage), probably positive (on the balance of probabilities, but less characteristic staining), and negative.
Analysis
The interpretation of the results when using a test with imperfect specificity is based on the assumption that, in order to conclude that the population is free from infection, any positive result identified is really a false positive. With a sample size of 450, up to 10 false positives may be expected while still concluding that the population is free from disease. However, if there is reasonable evidence that there is even a single true positive, then the population cannot be considered free. This is the reason for the classification of positive results into definitive and probable positives. If there are any definitive positives at all, the population in that estuary should be considered infected. The probable positives are consistent with false positives, and therefore up to ten may be accepted. Using FreeCalc the actual confidence achieved based on the number of (presumed) false positives detected can be calculated. For instance, if 8 ‘probably positive’ results were detected from an estuary, the confidence level for the survey would be 98.76%. On the other hand, if 15 ‘probably positive’ results were detected, the confidence is only 61.9%, indicating that the estuary is likely to be infected.
Discussion
Normally, it may be safely assumed that a surveillance system aimed at demonstrating freedom from disease is 100% specific. This is because any suspected occurrence of disease is investigated until a definitive decision can be made. If the conclusion is that the case is truly a case of disease, then there is no issue of declaring freedom – the disease is known to be present. This example presents a different situation where, due to lack of suitable tests, it is not possible for the surveillance system to be 100% specific. This may represent an unusual situation in practice, but illustrates that methods exist for dealing with this sort of problem. In practice, a conclusion that a country (or estuary) is free from infection, in the face of a small (but statistically acceptable) number of positive results, will usually be backed up by further evidence (such as the absence of clinical disease).
FreeCalc – Cameron, AR. Software for the calculation of sample size and analysis of surveys to demonstrate freedom from disease. Available for free download from http://www.ausvet.com.au
International EpiLab, Denmark, Research Theme 1: Freedom from disease. http://www.vetinst.dk/high_uk.asp?page_id=196
Survey Toolbox for Aquatic Animal Diseases – A Practical Manual and Software Package. Cameron A.R. (2002). Australian Centre for International Agricultural Research (ACIAR), Monograph No. 94, 375 pp. ISBN 1 86320 350 8. Printed version available from ACIAR (http://www.aciar.gov.au). Electronic version available for free download from http://www.ausvet.com.au
|
2015 ©OIE - Aquatic Animal Health Code |


